MatVisual pictures in some journal papers
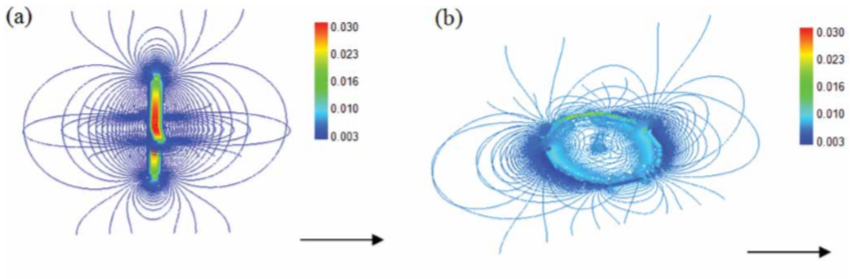
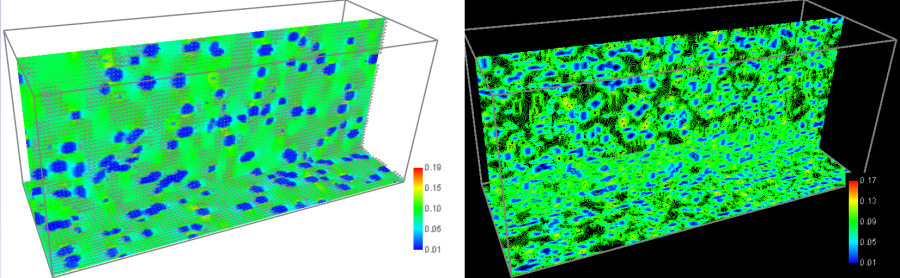
1. In "Mesoscale modelling of miscible and immiscible multicomponent fluids", Scientific Reports, 9 (2019) 8277, Figs. 3, 6 and 9 were plotted using MatVisual. Followings are Fig. 9(a) and 9(b).
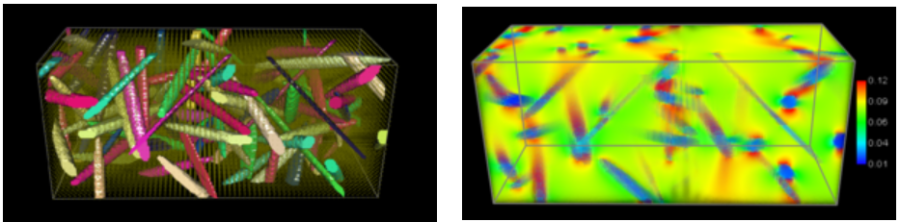
2. In "Alignment of rods and flakes using electric field", Advanced Materials Letters, 10 (2019) 899-902, Figure 2-5 were plotted using MatVisual. Followings are Fig.2(a) with added electric current density and Fig. 3(a).
3. In "Fabrication of nanostructured pearlite steel wires using electropulsing", Materials Science and Technology 34 (2018) 29–34, Figs. 1, 2 and 4 were plotted using MatVisual. Followings show Fig. 4(a) and 4(b).
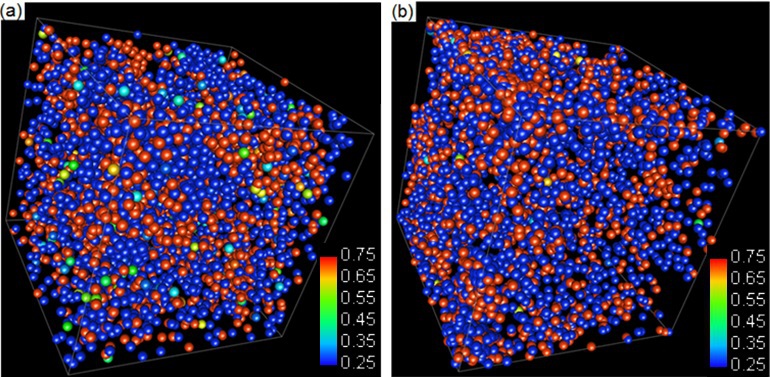
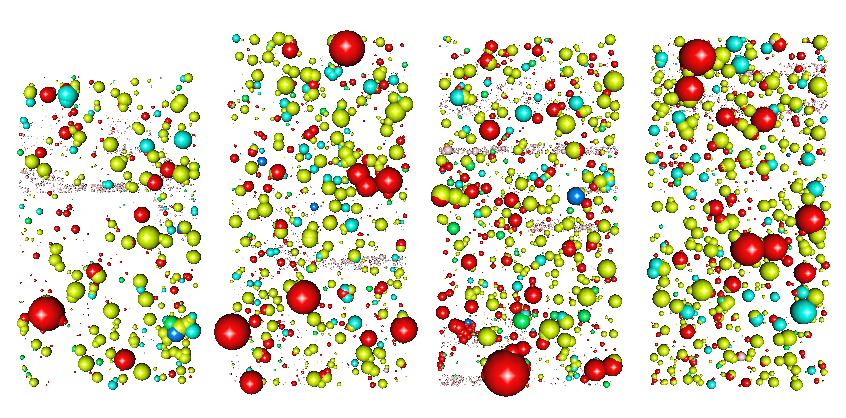
4. In "Using electric current to surpass the microstructure breakup limit", Scientific Reports, 7 (2017) 41451, Figs 2, 4 and 5 were plotted using MatVisual. Followings are additional plotting to the configuration of Fig. 4(c).
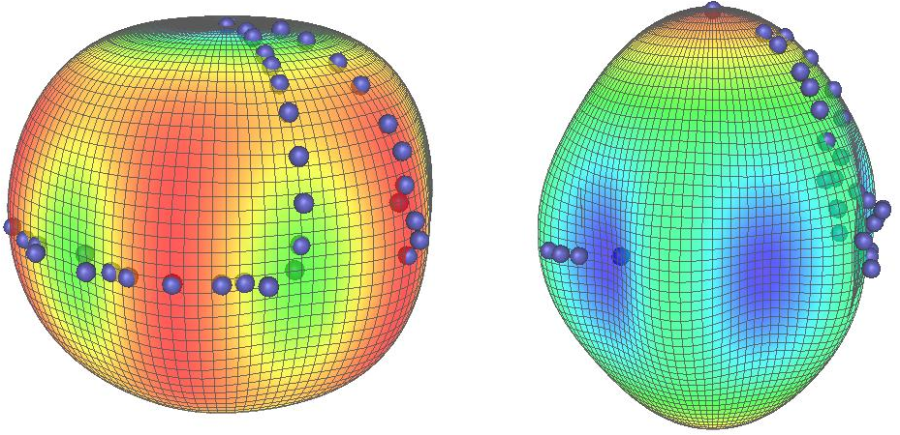
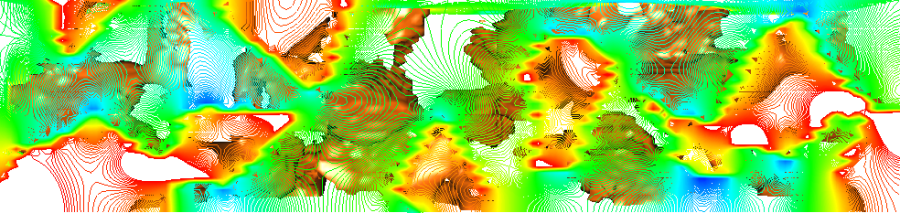
5. In "Anti-aging treatment of nuclear power plant steel", Materials Science & Engineering A 735 (2018) 73–80, Fig 7 was plotted using MatVisual, as shown in followings.
6. In "Controlled motion of electrically neutral microparticles by pulsed direct current", Scientific Reports, 5 (2015) 10162, some images in Figs in 2 and 3 were extracted from the following overall image and were plotted using MatVisual. The data were obtained from scanning electron microscope.
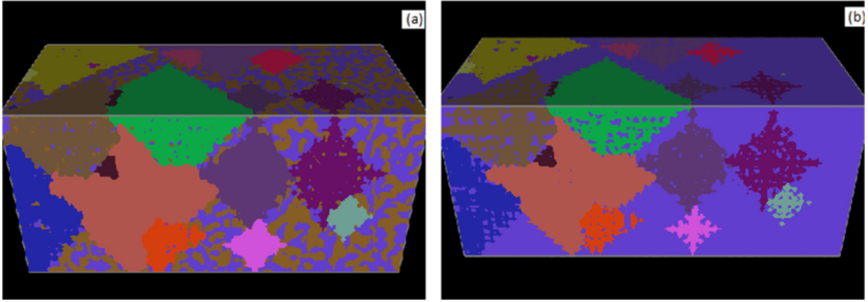
7. In "Modelling the microstructure of martensitic steels", Computational Materials Science, 96 (2015) 102–107, Figs 2-5 were plotted using MatVisual. Followings show the microstructure of another steel.

8. In "A three-dimensional cellular automata model coupled with finite element method and thermodynamic database for alloy solidification", Journal of Crystal Growth 377 (2013) 72–77 , Figs 3, 4 and 7 were plotted using MatVisual. Followings are Fig. 4(a)-(b).

9. In "Topology of the deformation of a non-uniform grain structure", ISIJ International, 49 (2009) 115–118, Figs 1, 2(a-b) and 5 were plotted using MatVisual. Following is from Fig. 1 showing the space filling tetrakaidecahedra of identical size.
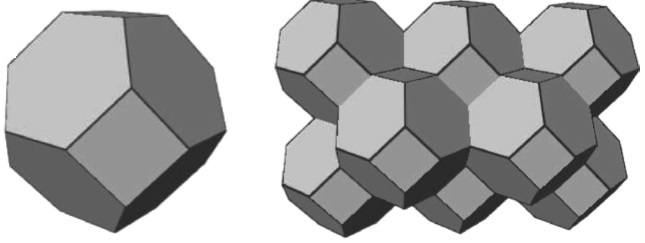
In fact, MatVisual can help to generate every desirable structure, such as following ones
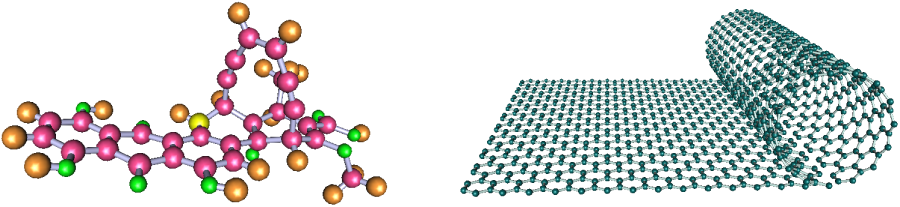
10. In "Phase-field model study of the crystal morphological evolution of hcp metals", Acta Materialia 57 (2009) 3382–3390 , Figs 5-9 were plotted using MatVisual. Followings are Fig. 5 Gd and Hf.